‘Coherence’
Sizing Coherence Indexes
Monday, April 28th, 2014
This post suggests three ways to measure index sizes in Coherence: (a)Using the Coherence MBean (not recommended) (b) Use JMX to GC the cluster (ideally programatically) as you add/remove indexes – this is intrusive (c) Use the SizeOf invocable (recommended) – this requires teh use of a -javaagent option on your command line.
(a) The Coherence MBean
Calculating the data size is pretty easy, you just add a unit calculator and sum over the cluster (there is code to do that here: test, util). Indexes however are more tricky.
Coherence provides an IndexInfo MBean that tries to calculate the size. This is such an important factor in maintaining you cluster it’s worth investigating.
Alas the IndexInfo Footprint is not very accurate. There is a test,IsCoherenceFootprintMBeanAccurate.java,which demonstrates there are huge differences in some cases (5 orders of magnitude). In summary:
– The Footprint is broadly accurate for fairly large fields (~1k) where the index is unique.
– As the cardinality of the index drops the Footprint Mbean starts to underestimate the footprint.
– As the size of the field being indexed gets smaller the MBean starts to underestimate the index.
Probably most importantly for the most likely case, for example the indexed fields is fairly small say 8B, and the cardinality is around half the count, the MBean estimate is out by three orders of magnitude.
Here are the results for the cardinality of half the count and field sizes 8B, 16B, 32B
     Ran: 32,768 x 32B fields [1,024KB indexable data], Cardinality of 512 [512 entries in index, each containing 64 values], Coherence MBean measured: 49,152B. JVM increase: 3,162,544B. Difference: 6334%
     Ran: 65,536 x 16B fields [1,024KB indexable data], Cardinality of 512 [512 entries in index, each containing 128 values], Coherence MBean measured: 40,960B. JVM increase: 5,095,888B. Difference: 12341%
     Ran: 131,072 x 8B fields [1,024KB indexable data], Cardinality of 512 [512 entries in index, each containing 256 values], Coherence MBean measured: 40,960B. JVM increase: 10,196,616B. Difference: 24794%
In short, it’s too inaccurate to be useful.
(b) Using JMX to GC before and after adding indexes
So the we’re left with a more intrusive process to work out our index sizes:
- Load your cluster up with indexes.
- GC a node and take it’s memory footprint via JMX/JConsole/VisualVm
- Drop all indexes
- GC the node again and work out how much the heap dropped by.
I have a script which does this programatically via JMX. It cycles through all the indexes we have doing:
ForEach(Index) { GC->MeasureMemory->DropIndex->GC->MeasureMemory->AddIndexBack }This method works pretty well although it takes a fair while to run if you have a large number of indexes, and is intrusive so you couldn’t run in production. It also relies on our indexes all being statically declared in a single place. This is generally a good idea for any project. I don’t know of a way to extract the ValueExtractor programatically from Coherence so just use the static instance in our code.
(c) Use Java’s Inbuilt Instrumentation
This is the best way (in my opinion). It’s simple and accurate. The only issue is that you need to start your coherence processes with a javaagent as it’s using the Instrumentation API to size indexes.
The instrumentation agent itself is very simple, and uses the library found here. All we need to wrap that is an invocable which executes it on each node in the cluster.
The invocable just loops over each cache service, and each cache within that service, calculating the size of the IndexMap using the instrumentation SizeOf.jar
To implement this yourself:
1) Grab these two classes: SizeOfIndexSizer.java, IndexCountingInvocable.java and add them to your classpath. The first sets the invocable off, handling the results. The second is the invocable that runs on each node and calculates the size of the index map.
2) Take a copy of SizeOf.jar from here and add -javaagent:<pathtojar>/SizeOf.jar to your command line.
3) Call the relevant method on SizeOfIndexSizer.
When is POF a Good Idea?
Saturday, April 12th, 2014
POF is pretty cool. Like Protocol Buffers, which they are broadly similar to, POF provides an space-efficient, byte-packed wire / storage format which is navigable in its binary form. This makes it a better than Java serialisation for most applications (although if you’re not using Coherence then PB are a better bet).
Being a bit-packed format it’s important to understand the performance implications of extracting different parts of the POF stream. This being different to the performance characteristics of other storage formats, in particular fixed width formats such as those used in most databases which provide very fast traversal.
To get an understanding of the POF format see the primer here. In summary:
1. Smaller than standard Java Serialisation: The serialised format is much smaller than java serialisation as only integers are encoded in the stream rather than the fully class/type information.
2. Smaller than fixed-width formats: The bit-packed format provides a small memory footprint when compared to fixed length fields and doesn’t suffer from requiring overflow mechanisms for large values. This makes it versatile.
3. Navigable: The stream can be navigated to read single values without deserialising the whole stream (object graph).
Things to Watch Out For:
1. Access to fields further down the stream is O(n) and this can become dominant for large objects:
Because the stream is ‘packed’, rather than using fixed length fields, traversing the stream is O(n), particularly the further down the stream you go. That’s to say extracting the last element will be slower than extracting the first. Fixed width fields have access times O(1) as they can navigate to a field number directly.
We can measure this using something along the lines of:
Binary pof = ExternalizableHelper.toBinary(object, context);
SimplePofPath path = new SimplePofPath(fieldPos);//vary the position in the stream
PofExtractor pofExtractor = new PofExtractor(ComplexPofObject.class, path);

while (count --> 0) {
    PofValue value = PofValueParser.parse(pof, context);
    pofExtractor.getNavigator().navigate(value).getValue();
}
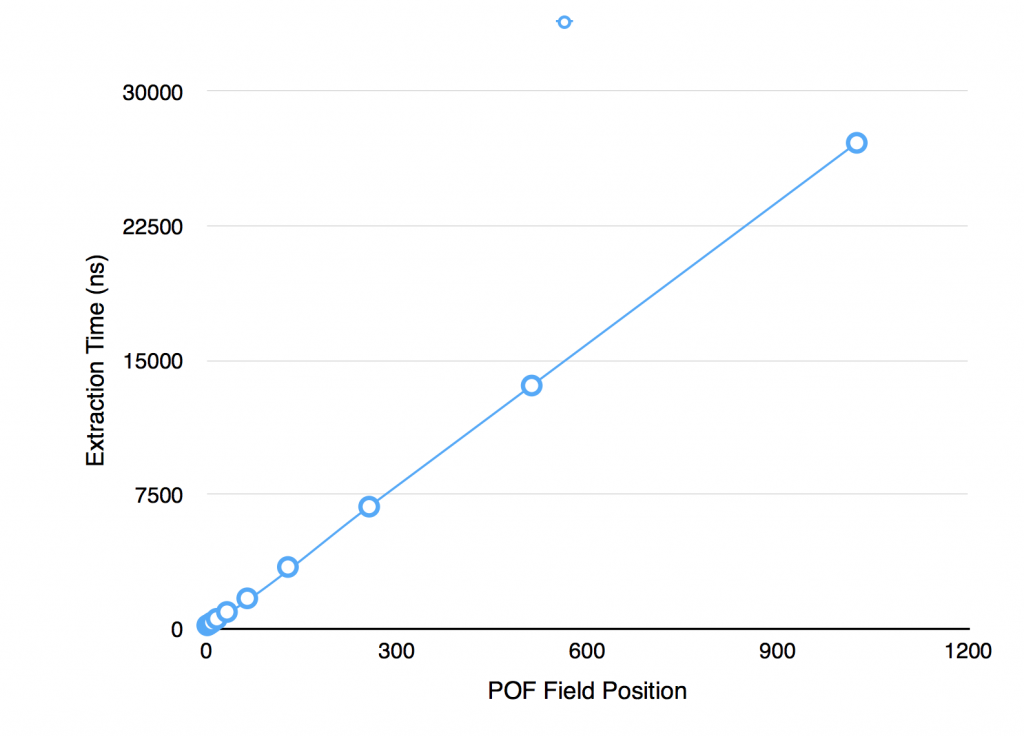
If you want to run this yourself it’s available here: howMuchSlowerIsPullingDataFromTheEndOfTheStreamRatherThanTheStart(). This code produces the following output:
> Extraction time for SimplePofPath(indices=1) is 200 ns
> Extraction time for SimplePofPath(indices=2) is 212 ns
> Extraction time for SimplePofPath(indices=4) is 258 ns
> Extraction time for SimplePofPath(indices=8) is 353 ns
> Extraction time for SimplePofPath(indices=16) is 564 ns
> Extraction time for SimplePofPath(indices=32) is 946 ns
> Extraction time for SimplePofPath(indices=64) is 1,708 ns
> Extraction time for SimplePofPath(indices=128) is 3,459 ns
> Extraction time for SimplePofPath(indices=256) is 6,829 ns
> Extraction time for SimplePofPath(indices=512) is 13,595 ns
> Extraction time for SimplePofPath(indices=1024) is 27,155 ns
It’s pretty clear (and not really surprising) that the navigation goes O(n). The bigger problem is that this can have an affect on your queries as your datasize grows.
Having 100 fields in a pof object is not unusual, but if you do, the core part of your query is going to run 20 slower when retrieving the last field than it is when you retrieve the first.
For a 100 field object, querying on the 100th field will be 20 times slower than querying the first
This is just a factor of the variable length encoding. The code has no context of the position of a particular field in the stream when it starts traversing it. It has no option but to traverse each value, find it’s length and skip to the next one. Thus the 10th field is found by skipping the first 9 fields. This is in comparison to fixed length formats where extracting the nth field is always O(1).
2) It can be more efficient to deserialise the whole object, and makes your code simpler too
If you’re just using a simple filter (without an index) POF makes a lot of sense, use it, but if you’re doing more complex work that uses multiple fields from the stream then it can be faster to deserialise the whole object. It also makes your code a lot simpler as dealing with POF directly gets pretty ugly as the complexity grows.
We can reason about whether it’s worth deserialising the whole object by comparing serialisation times with the time taken to extract multiple fields.
The test whenDoesPofExtractionStopsBeingMoreEfficient() measures the break even point beyond which we may as well deserialise the whole object. Very broadly speaking it’s 4 extractions, but lets look at the details.
Running the test yields the following output:
On average full deserialisation of a 50 field object took 3225.0ns
On average POF extraction of first 5 fields of 50 took 1545.0ns
On average POF extraction of last 5 fields of 50 took 4802.0ns
On average POF extraction of random 5 fields of 50 took 2934.0ns
Running this test and varying the number of fields in the object leads to the following conclusions.
– for objects of 5 fields the break even point is deserialising 2 pof fields
– for objects of 20 fields the break even point is deserialising 4 pof fields
– for objects of 50 fields the break even point is deserialising 5 pof fields
– for objects of 100 fields the break even point is deserialising 7 pof fields
– for objects of 200 fields the break even point is deserialising 9 pof fields
Or to put it another way, if you have 20 fields in your object and you extracted them one at a time it would be five times slower than deserialising.
In theory the use of the PofValue object should optimise this. The PofValueParser, which is used to create PofValue objects, effectively creates an index over the pof stream meaning that, in theory, reading multiple fields from the pof value should be O(1) each. However in these test I have been unable to see this gain.
Conclusions/Recommendations
Pof is about more than performance. It negates the need to put your classes (which can change) on the server. This in itself is a pretty darn good reason to use it. However it’s worth considering performance. It’s definitely faster than Java serialisation. That’s a given. But you do need to be wary about using pof extractors to get individual fields, particularly if you have large objects.
The degradation is O(n), where n is the number of fields in the object, as the stream must be traversed one field at a time. This is a classic space/time tradeoff. The alternative, faster O(1), fixed-width approach would require more storage which can be costly for in memory technologies.
Fortunately there is a workaround of sorts. If you have large objects, and are using POF extraction for your queries (i.e. you are not using indexes which ensure a deserialised field will be on the heap), then prefer composites of objects to large (long) flat ones. This will reduce the number of skipPofValue() calls that the extractor will have to do.
If you have large objects and are extracting many fields to do their work (more than 5-10 extractions per object) then it may be best to deserialise the whole thing. In cases like this pof-extraction will be counter productive, at least from a performance perspective. Probably more importantly, if you’re doing 5-10 extractions per object, you are doing something fairly complex (but this certainly happens in Coherence projects) so deserialising the object and writing your logic against PoJos is going to make your code look a whole lot better too. If in doubt, measure it!
Ref: JK posted on this too when we first became aware of the problem.
POF Primer
Saturday, April 12th, 2014
This is a brief primer on POF (Portable Object Format) used in Coherence to serialise data. POF is much like Google’s Protocol Buffers so if you’re familiar with those you probably don’t need to read this.
POF a variable length, bit-packed serialisation format used to represent object graphs as byte arrays in as few bytes as possible, without the use of compression. Pof’s key property is that it is navigable. That is to say you can pull a value (object or primitive) out of the stream without having to deserilalise the whole thing. A feature that is very useful if you want to query a field in an object which is not indexed.
The Format
Conceptually simple, each class writes out its fields to a binary stream using a single bit-packed (variable length encoded) integer as an index followed by a value. Various other pieces of metadata are also encoded into the stream using bit-packed ints. It’s simplest to show in pictorially:
Variable Length Encoding using Bit-Packed Values
Variable length encoding uses as few bytes as possible to represent a field. It’s worth focusing on this for a second. Consider the job of representing an Integer in as few bytes as possible. Integers are typically four bytes but you don’t really need four bytes to represent the number 4. You can do that in a few bits.
PackedInts in Coherence take advantage of this to represents an integer in one to five bytes. The first bit of every byte indicates whether subsequent bytes are needed to represent this number. The second bit of the first byte represents the sign of the number. This means there are six ‘useful’ bits in the first byte and 7 ‘useful’ bits in all subsequent ones, where ‘useful’ means ‘can be used to represent our number’.
Taking an example let’s look at representing the number 25 (11001) as a bit-packed stream:
       25     //Decimal
       11001  //Binary
[0 0 0011001] //POF (leading bits denote: whether more bytes are needed, the sign)
Line 1 shows our decimal, line 2 its binary form. Line 3 shows how it is represented as POF. Note that we have added four zeros to the front of the number denoting that no following bytes are required to represent the number and that the number is positive.
If the number to be encoded is greater than 63 then a second byte is needed. The first bit again signifies whether further bits will be needed to encode the number. There is no sign-bit in the second byte as it’s implied from the first. Also, just to confuse us a little, the encoding of the numeric value is different to the single-byte encoding used above: the binary number is reversed so the least significant byte is first (the whole number appears reversed across the two bytes). So the number 128 (10000000) would be encoded:
     128                //Decimal
     10000000           //Binary
     00000001           //Binary (reversed)
     000000     00010   //Aligned
[1 0 000000] [0 00010]  //POF
The pattern continues with numbers greater than or equal to 2^13 which need a third byte to represent them. For example 123456 (11110001001000000) would be represented
     123456                          //Decimal
     11110001001000000               //Binary
     00000010010001111               //Reversed
     000000     1001000     0001111  //Aligned
[1 0 000000] [1 0001001] [0 0001111] //POF
Note again that the binary number is reversed and then laid with the least significant bit first (unlike the single btye encoding above).
In this way the average storage is as small as it can be without actually using compression.
Exploring a POF Stream (see Gist)
We can explore a little further by looking at the Coherence API. Lets start with a simple POF object:
    public class PofObject implements PortableObject {
        private Object data;

        PofObject(Object data) {
            this.data = data;
        }
        public void readExternal(PofReader pofReader) throws IOException {
            data = pofReader.readObject(1);
        }
        public void writeExternal(PofWriter pofWriter) throws IOException {
            pofWriter.writeObject(1, data);
        }
    }
We can explore each element in the stream using the readPackedInt() method to read POF integers and we’ll need a readSafeUTF() for the String value:
    SimplePofContext context = new SimplePofContext();
    context.registerUserType(1042, PofObject.class, new PortableObjectSerializer(1042));

    PofObject object = new PofObject("TheData");

    //get the binary & stream
    Binary binary = ExternalizableHelper.toBinary(object, context);
    ReadBuffer.BufferInput stream = binary.getBufferInput();

    System.out.printf("Header btye: %s\n" +
                    "ClassType is: %s\n" +
                    "ClassVersion is: %s\n" +
                    "FieldPofId is: %s\n" +
                    "Field data type is: %s\n" +
                    "Field length is: %s\n",
            stream.readPackedInt(),
            stream.readPackedInt(),
            stream.readPackedInt(),
            stream.readPackedInt(),
            stream.readPackedInt(),
            stream.readPackedInt()
    );

    System.out.printf("Field Value is: %s\n",
            binary.toBinary(6, "TheData".length() + 1).getBufferInput().readSafeUTF()
    );
Running this code yields:
> Header btye: 21
> ClassType is: 1042
> ClassVersion is: 0
> FieldPofId is: 1
> Field data type is: -15
> Field length is: 7
> Field Value is: TheData
Notice line 25, which reads the UTF String, requires the length as well as the value (it reads bytes 6-15 where 6 is the length and 7-15 are the value).
Finally POF Objects are nested into the stream. So if field 3 is a user’s object, rather than a primitive value, an equivalent POF-stream for the user’s object is nested in the ‘value’ section of the stream, forming a tree that represents the whole object graph.
The code for this is available on Gist and there is more about POF internals in the coherence-bootstrap project on github: PofInternals.java.
Cluster Time and Consistent Snapshotting
Wednesday, May 9th, 2012
Banks, in particular, often need snapshotting where a snapshot represents an immutable set of data. Ultimately this is a set of versioned keys that describe some set of data that can be requested again and again and will always be the same.
One approach to snapshotting is to simply copy a set of versioned keys somewhere to represent the snapshot. This works for small datasets but it is quite limited as an approach. A better approach is to use time to snapshot your data and this is the mechanism used by databases that implement snapshot isolation as a concurrency control mechanism.
This is the approach used in bi-temporal databases using the concept of tuple-versioning.
Let us first assume you have implemented versioning of your data so that it is immutable. Next the versioned objects can be augmented with two times that represent system times when the version arrived and when it was replaced (if you do the same with business time you will have a truly bi-temporal store):
public interface MyBusinessObject{
   public Date arrivedAt();
   public Date supersededAt();
}
arrivedAt() corresponds to when the time is written, supersededAt() is the time when the object version is replaced (or null/infinite if it is the most recent object).
This allows queries to be written that isolate a snapshot the system at a point in time.
select * from system where arrivedAt > desiredTime and supercededAt <= desiredTime
This is a fairly simple and widely implemented concept.
The problem with this approach is that you need an accurate and consistent implementation of time in a distributed environment where system clocks vary
In Coherence and other distributed systems you do not always have a consistent time at your fingertips. As with most approaches there is an easy way and a harder way.
The Easy (trivial) Way
Keep it simple and channel all writes through a single process. Use this single System Clock on the writer process to source time. If the process restarts it needs to check the last written time to ensure time doesn’t go backwards (as it can with NTP or simple time variance across machines).
The Harder Way
This approach is better if you want to embrace distribution and not write all your data through a single process. This is a good idea for any system that supports heavy write workloads.
The problem with applying tuple versioning is that you need an accurate concept of cluster time. A time that is consistant accross all nodes and does not go backwards. Coherence already has a cluster time concept that does not go backwards, but it is not sufficient for this case as it will not guarentee that writes occur at the same temporal point (that is to say there can be variation across the nodes none the less).
Implementing cluster time for the purpose of snapshotting in a truly distributed environment requires a trick. The trick is to view the system in epochs, where each epoch will be consisten. In addition we use two concepts of time: write-time and read-time where the condition holds: write-time is always greater than read-time across the cluster.
Trick: Have two times: write and read time. Write-time is always greater than read-time across the cluster so that, at any read-time-snapshot, all writes for that snapshot will have been completed.
Using this trick you can guarantee that reads done using read-time will be repeatable and consistent at any node in the cluster.
To understand how this works we’re going to introduce the concept of a cluster-clock. The clock ticks along setting write-time and read-time on all nodes. The condition it will uphold is that at any read time all writes for that time will have been completed.

The implementation of this cluster-clock takes a little thinking about. Firstly you need a singleton service for the clock to live in. There will only be one clock running in the cluster and this needs to be fault tolerant. The singleton-service pattern for doing this is described here.
Next the clock needs to ensure our above condition that read-time always supersedes all writes for that time. Do this by iterating over all nodes in the cluster in turn:
- Iterate over all nodes in the cluster setting write time = T
- Iterate over all nodes in the cluster setting read time T-1 (as we now know no nodes will be writing with T-1)
- Iterate over all nodes in the cluster setting write time = T+1
- Iterate over all nodes in the cluster setting read time = T (as we now know no nodes will be writing with T+1)
- continue to loop….
This is described in the figure. We originally attempted this this using replicated caches to hold the times but unfortunately this does not work. Replicated caches do not behave quite as you might think. They do not wait for data to be synchronised with all nodes.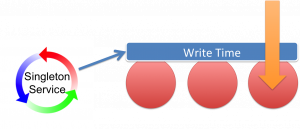
The approach we use now is an invocable that is synchronously broadcast to the cluster. The invocable performs the ticks on each node.
As writes enter the system object version numbers along with arrivedAt/supercededAt data is written through triggers. The triggers access the current write-time on the data node and use this to set arrivedAt() and supercededAt() appropriately.
Snapshot queries then work by querying objects where arrivedAt() > readTime and supercededAt() <= readTime.
The read-time corresponds to a snapshot. To take a snapshot of the system, you simply ask it what is the current read-time. In our case the readtime is taken from the extend proxy the client connects to.
Queries using this snapshot of read-time in this manner are guaranteed to be repeatable.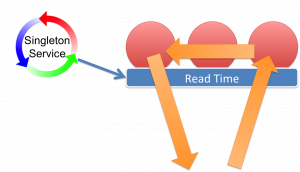
Finally there can be multiple versions returned by this mechanism which must be removed. The cluster time is in fact more like an epoch so multiple versions can exist in each ‘tick’. In ODC we standardise the ticks of the clock to be every second (they will be at least one second, possibly more particularly if nodes are doing garbage collection).
This means you snapshot queries need to take into account that they may return multiple objects that match the read-time epoch. This is simply a case of only selecting the object with the highest version (assuming you are implementing versioning on your objects using triggers as described here). We do this as part of the query by using an aggregator.
GUI Sorting and Pagination with Chained CQCs
Sunday, April 15th, 2012
This is a simple trick, useful for cleanly implementing GUIs where the memory availability varies across different layers.
A common pattern is for there to be a Coherence Cache that contains a data and a GUI will require some subset of that data. Individual screens further require filtration. 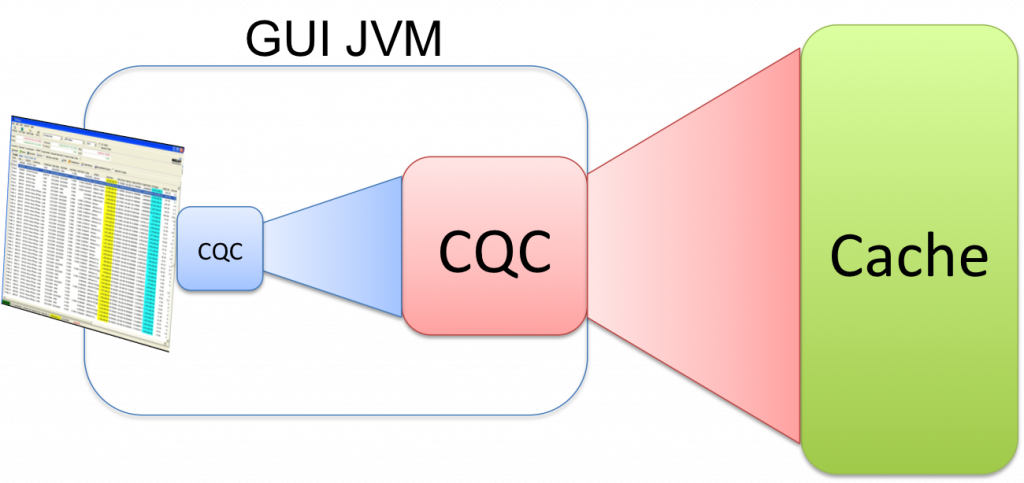
Chaining CQCs is a simple and elegant way of doing this as it lets you decide, through config, where each CQC will reside.
Taking the rich client example you might request all trades for a desk be sent to the client (this analogy works equally well for a webserver process). This can be implemented as a CQC selecting all trades in a desk.
A trader then applies a subsequent filter to his blotter to restrict it to only three books. If you implement this as a further CQC, run on the current CQC it will apply the filtering for you (the objects will not be duplicated but the matching keys will).
The nice thing about this pattern is that where you place each CQC (in the client/webserver or on the cache itself) is up to you and you can thus easily tailor it according to the memory availability of each layer /latency requirements. Moving them around is just config.
Credit to Damian Guy / Jon Knight for coming up with this neat idea.
The Collections Cache
Monday, November 7th, 2011
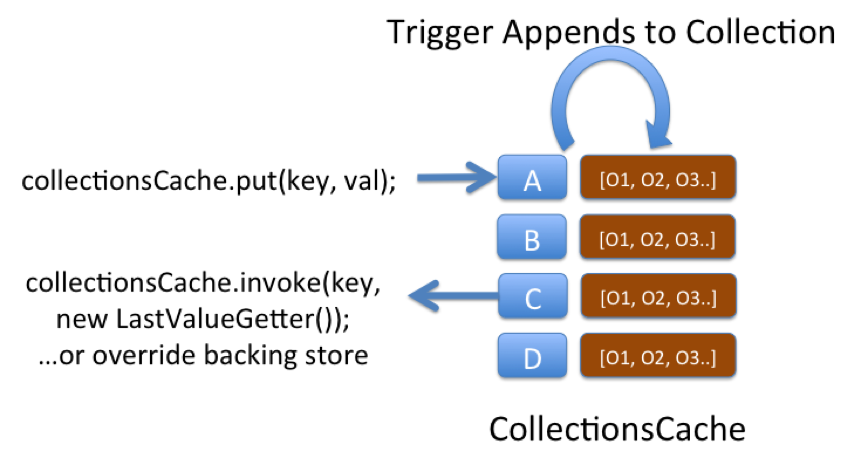
This is a very simple pattern that can be used to solve a variety of problems. The structure uses a “Collections Cache”: a cache that appends values to a collection using a Trigger. You can then access the entire collection using a get() or alternatively use an EntryProcessor to extract a certain value from the collection.
The pattern is used on ODC to track aggregate views. Say you want a materialised view of trades grouped by book. We keep a reverse index of trade references for each book. The view is updated asynchronously as data is added to the cache using an async CacheStore. The pattern is applicable to a variety of other use cases, one being an approach to managing version history.
One downside of this pattern is that if the concept is not well known it can be confusing, after all the object you put() is not the same type as is returned from a get(). Simple naming as collections* can help avoid this confusion though.
Singleton Service
Saturday, November 5th, 2011
 Being a data grid, Coherence is very good at doing things in a distributed way across all nodes in the cluster. However it doesn’t offer any functionality (currently) for running a service just the once, in a reliable manner. Most applications solve this problem by simply running another process, for example you might start a second process that reads data off some queue and keeps your cluster up to date. It’d be nice however if you could leverage Coherence’s fault tolerance to ensure that, if the cluster was running, your QueueListener was always running too. In fact this is fairly simple to do and can be used for a host of common applications including loading data, keeping it up to date, adding indexes and regulating a cluster wide time stamp (article to follow).
What we want is a service that will always run on one of our Coherence nodes no matter what happens to the cluster.
This solution is conceptually simple. You have lots of processes in your cluster. When each node starts it simply checks whether the service has already been started elsewhere by attempting to lock a fictitious, well-known key:
lockCache.lock(“SingletonLockKey”);
Only one of the processes in the cluster will attain the lock. If it does attain it then it starts the Singleton Service, adds indexes, loads data or whatever. Simple. If the node running the service dies then the lock is released and another process will acquire it and start the singleton service there.
//Run in a new thread on a wrapped DefaultCacheServer i.e. should run on every node
int blockUntilLockAquired = -1;
lockCache.lock(“SingetonLockKey”);
while(true){
   boolean locked = lockCache.lock("singletonLockKey", blockUntilLockAquired);
   if(locked){
      //start singletons here
      wait();
   }
}
Reliable version of putAll()
Friday, November 4th, 2011
I like triggers in Coherence. They allow us to do lots of cool stuff to our objects as we add them to the cache. Implement versioning, stamp them with cluster time, save them to a messaging system, check for duplicate writes, check for concurrent writes … the list goes on. But with all this processing comes the risk of failure and Coherence provides little in the way of exception reporting. In fact it provides no information on the individual failures, something that quickly becomes a problem as the level of trigger functionality increases. On ODC this caused us a real problem so we re-implemented putAll() so that it correctly reported those writes that failed. Credit goes to Jonathan Knight and Andrew Wilson for working this implementation through.
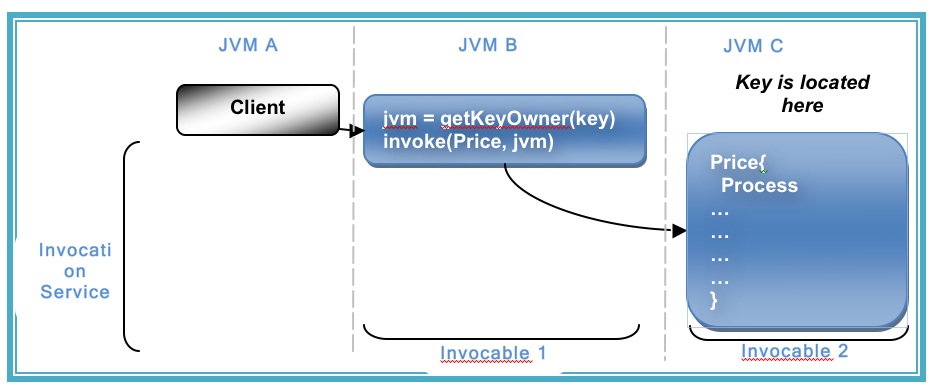
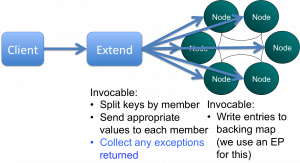 The pattern is pretty simple at a high level. It involves two Invocables. The first simply executes on the extend proxy, as we need to be inside the cluster to get access to the key assignment strategy. The next step is to split the data being written into the subsets applicable to each node using getKeyOwner(). These subsets are then sent, via a second Invocable, to the members that own them and EntryProcessors are used to do the write to the backing map directly (although this is no longer needed in 3.7). This is shown pictorially below.
You can view the code for doing this in the coherence-bootstrap project on Github: PutAllThatReportsIndividualExceptions.java
[Edit Jan ’12] My colleague Jon ‘The Gridman’ Knight has done a detailed and methodical post drilling into how to implement this pattern in Coherence]
An Overview of some of the best Coherence Patterns
Friday, November 4th, 2011
You can view the PDF version here
Latest-Versioned/Marker Patterns and MVCC
Wednesday, October 19th, 2011
Getting the basics right is obviously important. If you’re moving beyond what Andrew Wilson would call get-put man then you should be thinking about versioning your objects. That means making your data immutable. Doing this has a number of benefits:
- Versioning provides a historic record of changes.
- By linking versioning with the wall-clock / business times (i.e. bi-temporal) views of the system at previous points in time can be recomponsed. This is important for providing consistent views over your data.
- Versioning allows concurrency to be managed through Multi-Version Concurrency Control (MVCC)
Implementing Versioning
However simply adding versions to your objects (more precisely your object key) has the downside that you can no longer look up the value via it’s business key: you must know the business key as well as the version of the object that you want.
Key = [Business Key][Version]In Coherence accessing objects via their key directly is far more performant than doing a query (see The Fallacy of Linear Scalability) so it is preferable to keep the latest version of the object available via its business key alone. There are two common approaches to solving this problem: The Latest/Versioned pattern and the Latest Version Marker pattern.
Approach 1: Latest and Versioned Caches
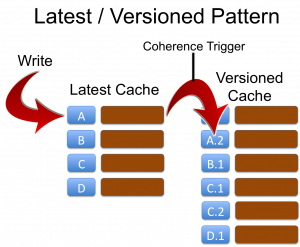
The first approach is to define two caches for every object. The Latest… cache and the Versioned… cache. The key of the ‘latest’ cache is simply the business key:
Latest Cache Key = [Business Key]This cache only ever contains the latest object. The ‘versioned’ cache contains all versions of the object with a, usually monotonically incrementing version embedded in the key:
Versioned Cache Key = [Business Key][Version]Writes must be directed at the ‘Latest’ cache and a Coherence Trigger is used to copy the object reference to the ‘Versioned’ cache adding the version onto the key as it does so. This is demonstrated in the first figure opposite.
The disadvantage of this approach is a memory inefficiency arising because the latest object exists in both Latest and Versioned caches. When the object is written the same reference can be used to save space, however the backup copies in each cache will be different instances and, should a node be lost, and process of recreating the primary from the backup copy will create new instances by default further eating memory. It is therefore advisable to use the LatestMarker pattern below when memory is a concern. The advantage of this approach is that it reduces the number of records in the latest caches which makes filter operations faster when they operate only on ‘Latest’ data (a common use case in most applications).
Checklist:
- Define two cache schemes based on the masks Latest* and Versioned* ensuring that they are in the same CacheService.
- In the Latest* scheme specify a trigger to forward objects to the versioned cache, incrementing the version as it does so.
- Specify KeyAssociation (Affinity) on the business key of the Latest* cache across both caches.
- Write a trigger that adds a monotomically incrementing version to the business key as it copies the value’s reference to the Versioned cache. You’ll need to use direct backing map access to avoid reentrancy problems (I’ve discussed the issues of reentrancy in Coherence before. See Merging Data And Processing: Why it doesn’t “just work”). The code sample below is provided for reference.
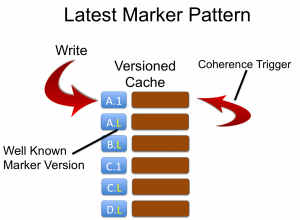
Approach 2: Versioned Cache Only With a Latest Version Marker
A second approach to solving the same problem is to only use a single cache with the key format:
Key = [Business Key][Version]but specifying that the latest version of an object has a special version marker:
KeyLatest = [Business Key][LatestVersionMarker]As clients are aware of the LatestVersionMarker (for example -1 is common) they can always access the latest value directly by calling:
cache.get([businessKey][-1])This approach does not suffer from the issues of duplication associated with separate Latest and Versioned caches but has the disadvantage that versioned data is in the same cache as latest data, marginally slowing down filters. Just reiterating that again: in this pattern there is only one copy of the latest object. The one with the latest marker. This is different to the latest/versioned pattern where the latest object will exist in both caches (so twice) so that the versioned cache can contain all versions of that object.
Checklist:
- Create a cache with a KeyAssociation on the business key (i.e. the key parts without the version number). Add a trigger that replaces the current value for the “LatestMarker” with the new object whilst copying the old value to a key with the appropriate real version. You’ll need to use direct backing map access to avoid reentrancy problems (I’ve discussed the issues of reentrancy in Coherence before [link]). See code sample below.
Implementing the trigger to avoid reentrancy issues
The below code outlines one mechanism for moving objects (in this case for the Latest/Versioned pattern) from one cache to the other using direct backing map access.
public void copyObjectToVersionedCacheAddingVersion(MapTrigger.Entry entry) {
   // I'm assuming that you are tracking the version, and incrementing it, in your object
   // Also note that it's more efficient to just take the version out rather than deserialise
   // the whole object but this way is more succinct
   MyValue value = (MyValue)entry.getValue();
   MyKey versionedKey = (MyKey)value.getKey();

   BinaryEntry binaryEntry = (BinaryEntry)entry;
   Binary binaryValue = binaryEntry.getBinaryValue();

   Map versionedCacheBackingMap = binaryEntry.getContext().getBackingMap("VersionedCacheName");
   versionedCacheBackingMap.put(toBinary(versionedKey), binaryValue);
}
If you are using Latest-Marker it’s essentially the same but with a marker key.
Latest/Versioned or Latest-Marker – which to choose?
Both patterns are good. We have use both extensively in my current project. Latest marker is probably best overall due to the aforementioned storage issues with Latest-Versioned. However if you are likely to make most use of the ‘Latest’ view, and will be scanning without the use of indexes, Latest-Versioned can offer performance benefits. It also feels simpler when you use it, as from the outside things are what they are.
These patterns are really important to use. They form the basis for many of the more advanced use cases. You need one of these to do MVCC, Snapshotting etc.
Note that affinity (Key Association) must be used to ensure that the versioning process is entirely local to the JVM doing the write.
Check out Andy Coates’ neat way for doing it here.
MVCC & Snapshotting
One of the main reasons for implementing these patterns is to allow more advanced features of MVCC and Snapshotting. MVCC is a concurrency control mechanism which is based on your objects being versioned. It is useful where two clients mutated the same version of the object and you want one to get a failure (and one write to succeed). This is very simple to implement in Coherence by including the object version in the write and have a trigger ensure that the version of the object being updated equals on the in the cache, otherwise exception.
Snapshotting is a more complex topic because it requires time so I’ve covered in a separate post here.
Related Posts
- Great post by Andy Coates on implementing this pattern with a bit more style [here]
- Use normalisation to reduce the versioning burden through the application of Star Schemas and Connected Replication [link]
- Performing cross cache joins in Coherence [link]
- Understanding problems of reentrancy in Coherence [link]
Joins: Advanced Patterns for Data Stores
Thursday, September 22nd, 2011
If you’ve hit this page you are probably thinking about adding joins to your Coherence cache. In general this is not a good idea. If your cache is that, a cache, you can use the aggregate pattern to solve most problems. Joins are complex and do at cost at runtime so only add them if you need them. However they can be very useful in some circumstances.
Why do you need joins, why not just use aggregates?
You need joins if you can’t aggregate all of your data into one object in the cache. If your data is mastered in a separate database it is unlikely that you will need more than the aggregate pattern. You only need joins if Coherence is being used as the System of Record or entry point to the system. If you are using the cache-aside pattern it is unlikely that you will need joins.
Joins are useful under these circumstances:
- Data arrives from different sources directly into the cache so it is desirable to versioned sources separately to accumulate individual histories and recombine at runtime.
- Entities need to be snapshoted independently
- Aggregates become overly weighty and a majority of requests don’t need the full aggregate so it is desirable to join at query time according to the user’s preference (there are other ways around this problem though including different aggregates as well as decomposing the aggregate on read).
Assuming you have one of the above use cases we’ll discuss how joins can be very useful.
The approach described here is the one taken on ODC at RBS. This is a project started in 2009 to build a centralised trade and reference data store in a bank. This use case is for a store, rather than a cache. In it Coherence plays the role of entry point to the system, hence joins are required to version independent histories and apply snapshotting.
Holding objects in a aggregate (denormalised) form leads to the problem of how you keep all that denormalised data consistent. Data must be duplicated and this both eats memory (and much more so if you implement versioning) as well as making it very hard to implement any kind of consistency across all those copies.
To get around this we use an approach which looks like (but is subtly different from) the Star-Schema approach used in data warehousing. Entities are denoted facts or dimensions where a fact is a big thing that needs to partitioned accross the grid and an dimension is a smaller thing that we can afford to replicate in our query processing layer as there are simply not that many of them. In fact we take this model a step further my tracking the arcs on our domain model and only replicating those that are ‘connected’… but more on that later (see here).
In this context: Facts are defined as big objects that require partitioning, Dimensions are smaller objects with cross-cutting keys that will be replicated.
Primer on the Coherence Implementation
In Coherence we split the application architecture into two layers: The Query Layer and the Data Layer. Dimensions are cached in Continuous Query Caches in the Query layer and the Facts are spread across the Coherence cluster. Related Facts can be joined in-process as Key Affinity is used to ensure collocation (i.e. they are partitioned with the same key and Coherence uses the key to determine which partition they should go in). Dimensions are replicated onto the Extend Proxies using CQC’s and the joins are done at the start and end of queries using dictionary lookups.
All dimensions are checked, in process, via the same CQCs used to speed up the 2-stage query. This has an unfortunate consequence: Changing a dimension will result in CQCs being updated across the cluster via one-phase commit. This presents a potential threat to atomaticity and isolation since the changing dimension will be incoherent across multiple JVMs during the one-phase commit. Fortunately query isolation in such a model is still ensured, from our perspective, by making the simplifying assumption: consistency is only implemented within the context of requests to a single extend proxy. This is a manageable assumption.
Further optimisation:
The application of what we denote the Connected-Replication Pattern further optimises the replication of Dimensions by ensuring that only Dimensions that are actively referenced from Facts are replicated – Dimensions are only replicated if they are actually connected to other parts of the domain model.
By only replicating data that is connected to the object graph we, in practice, only replicate 10% of the Dimensions we store. This is a huge advantage.
Further Background: Executing complex joins in Shared-Nothing Architectures
The context of the problem is any partitioned data store: one where data is spread across a number of machines. This approach was first suggested by Dewitt et al in the Gamma Database and popularised in the database community with the term Sharding. The Sharding approach has been extended in more recent technologies by partitioning both data and the responsibility for processing it in what is termed a Shared Nothing Architecture. In Shared Nothing each node is self-sufficient, each having autonomy over the data it holds and processes. It is this autonomy that allows data-stores following this pattern to scale linearly for some common query loads.
Shared Nothing Architectures however come at a price. The partitioning model breaks down when queries require intermediary results to be shipped between machines, particularly where those intermediary results do not form part of the final result. Examples include joins between ‘Fact’ tables (where the join keys must be moved from one machine to another), multidimensional aggregations such as multi-dimensional risk calculations (i.e. the OLAP domain) or transactional writes that span the partitioning strategy.
Fortunately, many modern use-cases, particularly in the OLTP space, have little requirement for complex joins that span large data sets. For these simpler use-cases queries can be compartmentalised on a single node via some common attribute that they all share (known as a partitioning key or Data Affinity in Oracle Coherence). For example access to data in an online banking application might group data pertaining to a certain user. By choosing the UserId as a partitioning key user-centric joins can be executed entirely a single node and hence will scale.
The counter-example is queries that require lots of joins that cross the partitioning strategy. Extending our banking example, listing the details of accounts that a user can make payments into would mean accessing data associated with a different user. As the UserID is the partitioning key, account information for different users will be located in a different partition. This typically requires key shipping: A two-stage query which first returns the users details then scans the cluster for the various account details for other users: the payees. This example is trivial but it alludes to a much larger problem when queries must include many different data items that cross partitioning (and hence machine) boundaries. It is these complex queries, those that need to join across a variety of crosscutting keys. The connected replication pattern addresses this problem.
Compromising between Aggregate and Snowflake
There are three fundamental concepts that are used to optimise distributed data storage: Replication, Partitioning and Indexing. When it comes to data placement we have just the two: Replication and Partitioning – with our aim being to remove the need for cross-partition joins.
The approach here is to split the aggregate data-model to pull out dimensions that you wish to version separately. This ends up looking a bit like Snowflake. The Snowflake-Schema is well known in the data-warehousing space but its application here is quite different as we use it to define what we replicate and what we partition.
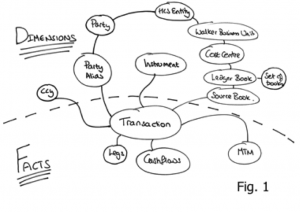
Take an object model such as that shown in Fig. 1. The dotted line represents the division between Facts and Dimensions. The line can only exist in one place: that being the point in the object model where it converges on a single entity – the focal point of one-to-many relationships. This focal point also identifies the most precise, commonly shared key among facts. Like the regular data warehousing application this can be described intuitively as Facts being the recorded fact, whilst dimensions represent the context that give that fact meaning.
The point of joins in this context is to allow sub-aggregates to be versioned separately and recombined at runtime
As an example let us consider a typical online shopping application, an Order would be a Fact whilst the Customer with which the Order is placed is a Dimension that provides the Order with ‘context’. This pattern is particularly applicable to distributed data storage as it provides a middle-ground between 3rd normal form, which presents too many joins for practical distributed applications and full denormalisation which presents a range of consistency issues when changes affect large numbers of denormalised entities (as well as proving problematic when objects need to be versioned).
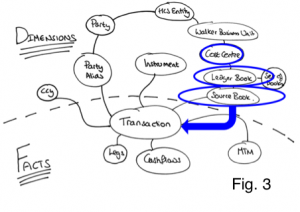
Snowflaking is important for tempering a version explosion (versioning of objects is important for MVCC, necessary in most non-trivial data stores). By holding sub entities separately they can be versioned independently meaning that a change in a sub entity, for example cashflows in the model in Fig. 3, does not necessitate a version increase on the other related objects: Transaction, MTM and Legs in this case. The alternative to this would be to hold all the data as a single Fact but any change would necessitate a new version of the whole group. This is version explosion is prohibitive when using in-memory architectures.
So we have divided our data model into a Snowflake-Schema. However there is little novel to that. The value from doing so becomes evident when we use the two classifications of entities, Facts and Dimensions, to drive whether data is to be partitioned or replicated. In this manner we are able to balance replication and partitioning so that no distributed, sequential join operations are required: joins where the key-set for one entity must be retrieved first from one set of machines followed by a second query to get related keys to complete the join from another entity, on another machine. Referring back to the at the object model in Figs. 1/3, to query transactions for the PartyAlias “City Group” where the Product is an “FX trade” we would first request the PartyAlias IDs for “City Group” (Stage 1 query), once that returned we would query for the product id for “FX trades” (Stage 2 query) and then finally we’d query for the Transactions that matched the keys for those PartyAlias’ and Products (Stage 3 query). It is this sequential set of distributed queries that affect performance.
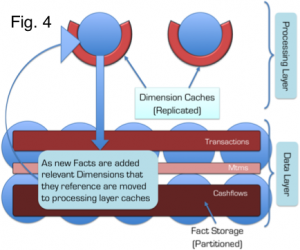
This problem is solved through the application of a Snowflake Schema so that Dimensions are replicated to the Query Layer that sits in front of the grid, whilst keeping the Facts partitioned in the grid itself (See Fig. 4). Queries still need to be sequential as described above, but importantly all the Dimension queries remain in process as the dimension data is replicated (there is no network call required) and hence the cost is minimised.
As an example of this Fig. 3 shows a typical query in which the ‘where’ clause specifies a Cost Centre. Sequential queries must navigate their way down the object model until they reach the lowest dimension. In this case Source Book. Because these dimensions are replicated everywhere the calls are in-process and hence will be fast. The result is a set of IDs for this ‘lowest’ Dimension. These IDs are then used to query the Facts, which are held partitioned across the cluster. A distributed call is made to the grid to retrieve Facts. Fact and Sub-Fact joins are done, in-process, in the various partitions across the grid (as we know related Facts and Sub-Facts will be collocated in the same partition).
This concept is not novel, the commercial databases Vertica, Greenplumb and other data warehousing products all make use of replicated data. However applying this pattern can be problematic. In-memory architectures are more constrained for storage than their disk-based brethren and replication is not a scalable storage pattern. This problem is addressed through the application of the Connected-Replication Pattern.
Making the Replication of Dimensions Practical in a Distributed In-Memory Architecture using the Connected-Replication Pattern
A reality of most commercial databases is that a large proportion of the data remains unused. This problem is highlighted by the work done around archiving in the database community. One recent study shows up to 80% of data in enterprise databases is no longer in use. The Connected Replication Pattern leverages this fact to reduce the amount of data that must be replicated by only replicating objects that are actively connected to Facts at any point in time.
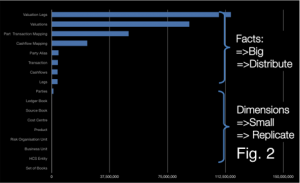
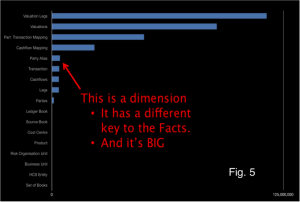
The growth of Dimension data is a problem when applying a Snowflake-Schema to achieve fast joins through the replication of Dimensions. The reality is that some Dimensions will inevitably be large. In fact the data set used above actually has includes some dimensions that are too large for replication. Fig. 5 includes that the Dimension “Party Alias” which is both very large and does not share the same key as the other Facts, so cannot be partitioned with them.
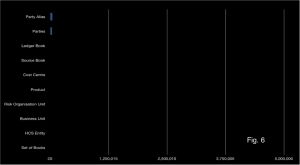
Connected Replication tracks the links between Dimensions and Facts as data is written to the store. This acts like a real time archiving process ensuring only the absolute minimum number of dimensions are replicated i.e. only those currently connected to Facts. Fig. 6 shows the size of dimensions after applying the Connected-Replication pattern using the same scale as Fig. 5. You can see there is more than an order of magnitude less data to replicate after Connected-Replication has been applied.
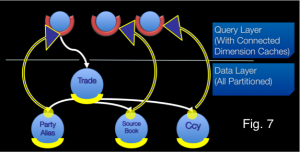
Under Connected-Replication, as data is written, a recursive process examines the relations between Dimensions and ensures that they are replicated. This is shown in the Fig. 7: A trade is written. It has three relations to PartyAlias, SourceBook and Ccy. A message is passed to the storage layer for each of these entities (the white lines) and if the Dimensions are not already replicated they are pushed into replicated storage in the Query Layer (the blue/yellow lines). This process recurses through all the arcs in the domain model until the Query Layer contains all “Connected-Dimensions”.
The mechanism can be either immediately or eventually consistent. The former not surprisingly decreases write performance. An offline process prunes the connected caches of unused dimensions corresponding to data that has been removed.
Hopefully you have seen that Connected-Replication provides a novel approach to balancing Replication and Partitioning so that joins can be done in-process whilst minimising the memory footprint. It is not necessary to have two layers. Replication could be added to all nodes in the grid (i.e. the two layers are folded together) but we find it preferable to hold them separately as the ODC has far more data nodes than it does query nodes (400 storage nodes are serviced by 40 query nodes). For our use case this provides a better use of memory.
There is more info on this in the slides from QCon and JavaOne
See Also:
Beyond the Data Grid: Coherence, Normalisation, Joins and Linear Scalability (QCon)
Performing Efficient Cross-Cache Joins in Coherence
Beyond the Data Grid: Coherence, Normalisation, Joins and Linear Scalability (QCon)
Thursday, January 27th, 2011
 Normalisation is, in many ways, the antithesis of typical cache design. We tend to denormalise for speed. Building a data store (rather than a cache) is a little different: Manageability, versioning, bi-temporal reconstitution become more important factors. Normalisation helps solve these problems but normalisation in distributed architectures suffers from problems of distributed joins, requiring iterative network calls.
We’ve developed a mechanism for managing normalisation based on a variant of the Star Schema model used in data warehousing. In our implementation Facts are held distributed (partitioned) in the data nodes and Dimensions are replicated throughout the query-processing nodes. To save space we track ‘used’, or as we term them ‘connected’ data, to ensure only useful objects are replicated.
This model was presented at the QCon 2011 and at the Coherence SIG.
You can find the slides here (Powerpoint – 7MB).
See Also:
The Fallacy of Linear Scalability
Saturday, December 12th, 2009
The underpinning of Shared Nothing data stores is that adding a machine to a cluster proportionally increases the amount of CPU, network bandwidth and storage available. This is, of course, a fact, however the statement is only really of value if the mechanism used for reading and writing data also scales linearly, with respect to each of these physical resources.
A typical Key-Value access pattern works well: store.put(key, val), store.get(key) scale linearly as the number of nodes in the cluster is increased. This scaling leverages the fact that data is sharded (spread) across the available machines. Any single read or write operation is simply routed to the machine that owns the partition i.e. only one machine is ever asked to service a single ‘get’.
The problem is that, in real world use cases, ‘get’ and ‘put’ are often not enough and data stores offer richer query interfaces. This leads users to inevitably more complex access patterns that necessitate the use of queries that do not access data via the primary key. The rub is that these queries don’t scale in the same way.
The efficiency of a K-V lookups comes from the hashing algorithm determining which machine the required value resides on. However when we query via an index there is no such optimisation to be made. Thus the query must be broadcast to all nodes in the cluster. This puts an upper bound on scalability in that:
the max number of queries serviced by the system = the max number of queries serviced by each machine
The implications for scalability are fairly obvious and noticeable when such stores are run at scale. What tends to happen in practice is that one physical resource forms the bottleneck. For high data-density systems this is often disk. So if the disk in one machine can support 100 queries per second, that will be the limit of the system no matter how many nodes it has, at least where secondary indexes are used to drive queries in this broadcast way. However, if queries per second is a direct function of data volume per machine, then adding more machines will reduce the amount of data held on each. This increases the performance of the cluster by decreasing the amount of work each node needs to perform per query.
So how do you manage this problem? There are a few techniques you can use:
-
Try to use key based access instead of queries wherever possible.
-
Increase the cluster size so that the amount of data serviced by each node is reduced. This decreases the response time for each request and thus the overall load on each server. It is however somewhat expensive and wasteful.
-
Another trick is to paginate the query over the available partitions. This doesn’t address the problem directly, rather it spreads each query over a longer time frame reducing the risk of load spikes.
So be wary of overusing secondary indexes!
Joins: Simple joins using CQC or Key-Association
Friday, November 20th, 2009
You need to return a data set made from related items in different distributed caches. You need to do a join. So how do you do it efficiently in Coherence?
As a general rule the aggregate pattern is the best approach for Coherence or other NoSQLs which implement cache aside. That is to say you are simply using the cache to scale data access, it is authored elsewhere – often a relational database. However sometimes it’s useful to use server side joins if you write data directly to the cache rather than using cache-aside. Use cases for this include datasets that vary independently (in our world trades and risk results are good examples – you want to version them independently but you often want the results combined without two separate calls from the client).
The Two Options
In practice there are two types of join that are worth considering. The first is the trivial case is where you join on the client or extend proxy and use near caching or CQCs to optimise this. The more complex option joins on the server using key affinity.
Simple joining in the client/extend (two-stage query) with NC/CQC optimisation
Lets look at the query ‘Get me orders for customers in Belgium’ with reference to the Northwind Database Schema:
Select o.* from Orders o, Customer c
where o.customerId = c.customerId
and c.country = 'Bulgium'
The normal query plan for such a query would involve separating the query into two sections for the two where clauses. This join is fairly easy to execute in the distributed world because the Customer table query is clearly smaller and hence should be evaluated first. That is to say that we know intuitively that “#Orders” >>> “#Customers in Belgium”.
//Stage 1
Set customersInBelgium = customersCache.keySet(
   new EqualsFilter("country", "Belgium")
);
//Stage 2
ordersCache.entrySet(
   new InFilter("customerId", customersInBelgium)
);
The best way to tackle a request like this is via a two-stage query hitting the Customer cache first and then the Orders cache. This assumes that the order can be efficiently predetermined because the proportional data populations are well known. If your Customer’s cache is relatively small you can make this 2-stage query have only one wire call by either adding Near Caching to the Customers cache so the join is local or wrap it in an invocable, run it on the server and put the Customers in a Replicated Cache.
Tip: Use Continuous Query Caches or Replicated Caches to make 2-Stage joins a single step
The Single-Step Case: Doing Joins With Affinity Across Multiple Distributed Caches
The more complex case arises when the two sub sections of the query still return very large result sets. Using the two-staged query method for this type of join would result in very large data sets being returned back to the client during the intermediary phase.
Implementing such a join efficiently involves using affinity to bind together related data from the two caches.
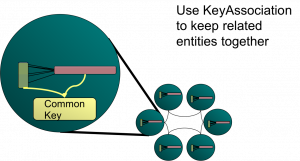
I discussed this in some detail, along with the problems it brings up, in an associated article (here), in particular the problems that arise from the Coherence threading model. However if you read this post you’ll probably guess how performing a join naturally follows on from the idea of collocated processing.
So lets look at how we do it using the Northwind Database Schema we used above. You wish to perform a query which, in SQL would be represented as such:
Select Orders.*
from Orders o, OrderDetails od
where o.orderId = od.orderId
and o.orderDate = today()
and od.unitPriceQuantityDiscount = 0.05
In this case both the result sets from the Orders part of the query and from the OrderDetails part will be large even though the end product might be quite small. If we were to do this as a two stage query in Coherence’s it would look like this:
Set orderIds = orders.keySet(new EqualsFilter("orderDate", new Date()));
orderDetails.entrySet(
   new AndFilter(
      new EqualsFilter("unitProceQuantityDiscount", 0.05),
      new InFilter("marketId", orderIds)
   )
);
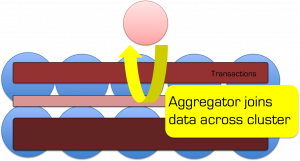 With the inefficiency that all the orderIds for today will be returned to the client before the order details are queried. Fortunately we can do this all in one go on the server. To do this we need the following tools:
- An Aggregator – this is the best way to run some custom code on the server that is based off a query.
- Affinity to bind the market and trades caches together so that corresponding entries are collocated (so when we find an order there is no network hop to get the corresponding OrderDetails record).
- Some funky backing map magic to efficiently get at the entries we need.
The code ends up looking as below where this is the aggregate method of an Aggregator operating on the Orders cache.
public Object aggregate(Set orders) {
    Map<Order, Details[]> all = new HashMap<Order, Details[]>();
    List<Details> buffer = new ArrayList<Details>();;

    for (BinaryEntry entry : (Set<BinaryEntry>) orders) {
        long orderId = (Long) entry.getKey();
        BackingMapContext context = entry.getContext().getBackingMapContext("order-details");
        Collection<Binary> valBackMap = context.getBackingMap().values();
        for (Binary val : valBackMap) {
            Details details = (Details) ExternalizableHelper.fromBinary(val, entry.getSerializer());
            if (details.getTradeId() == orderId) {
                buffer.add(details);
            }
        }
        all.put((Order) entry.getValue(), buffer.toArray(new Details[]{}));
        buffer.clear();
    }
    return all;
}
There is a better example of this (which you can run) here.
This method allows efficient joining of data across the cluster without shipping any data around. It works because we force Coherence to collocate Orders and OrderDetails with the same OrderId using Affinity. We then subvert the problems with the threading model (see here) by hitting the backing map directly.
There is one last trick that you may need to be aware of. The use case here was simplified because both tables have the same primary key. This is not always the case. If OrderDetails had a different PK, say OrderDetailsId, then we would not be able to access the OrderDetails backing map directly via the OrderId, instead we’d have to scan all objects in the backing map to look for it. The trick in this case is simply to set up your data model so that your OrderDetailsId is always derivable from the OrderId and other parameters that are mandatory in the query.
Using these two methods you can implement any type of join efficiently in Coherence. The only problem is that to reap these performance gains you need to know the join criteria, and something about your cache statistics, in advance.
Related Posts:
Find out how to do any join efficiently regardless of the key by applying snowflake schemas to manage replication and partitioning (HERE and a bit more here and here)
See JK’s post on Join filters here (much better than mine ;-))
unitPriceQuantityDiscount
How Fault Tolerant Is Coherence Really?
Wednesday, November 4th, 2009
Dessert Island Disks Top 3 reasons for using Coherence have to be: Speed, Scalability and Fault Tolerance.
When designing systems with Coherence it’s easy to get carried away with the latter, especially when you start to embed your own services and leverage the implicit fault tolerance.
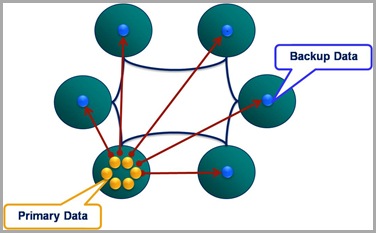
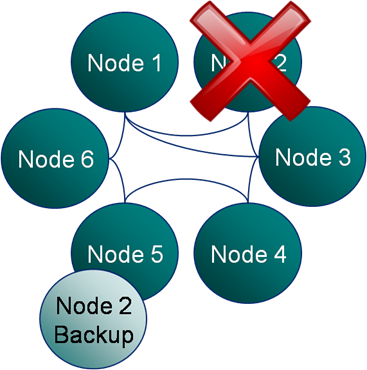
But in all this excitement I’ve often found myself overlooking what the guarantees really are. 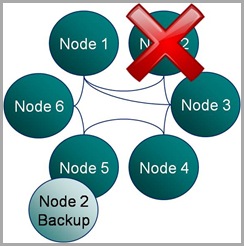 Most people know that Coherence backs up your data on another node so that if one process is lost it can be restored (see diagram). They also may know that the number of backups Coherence takes, for each piece of data you store, is configurable. However it takes a little consideration to become totally clear on what guarentees of fault tollerance Coherence really provides, hence my summary here.
There are two questions worth considering:
- How many machines failures can occur simultaneously without the cluster loosing data?
- What is the maximum reduction in cluster size under which the cluster can operate without data loss?
These two aspects of fault tolerance seem quite similar at first glance but they are driven from very different aspects of the technology. The first refers to concurrent loss of hardware. After a machine is lost Coherence will redistribute backups on the remaining hardware so that every partition has a backup somewhere else. The first question above arises where a second machine is lost before this redistribution phase has had an opportunity to run.
The second question is to do with physical resources, most commonly RAM. If you loose 1/3 of the machines in your cluster do you have enough memory on the rest of them to store a primary and backup copy for the data the lost machines were holding (currently Coherence will try to make a backup even if it means throwing an OutOfMemoryError – something I’m told is being addressed)? Physical memory tends to be the problem here as it is a hard limit (hit a CPU limit and you slow down, hit a memory limit and you get corruption) but hitting a CPU limit is probably equally likely on most clusters. The important point is that you size your cluster with this in mind. That’s to say that you include enough memory headroom for primary and backup copies of the data after the loss of some number of machines (An algorithm for sizing your cluster can be found here).
Having done such analysis however, and I know many teams that do, it’s tempting to then think your cluster can survive the loss of 1/3 of it’s hardware (or whatever resource overhead they provisioned) because there is enough physical resource for Coherence to recover. This would be true if the loss of nodes were separated in time but not if they occurred simultaneously.
For the simultaneous failure of machines, in the current version of Coherence (3.5), you can quantify the products fault tolerance as this:
The limit of Coherence’s fault tolerance is the loss of more than one physical machine in a cluster.
So where does this assumed limit come from? Well Coherence positions backup data based on two conditions:
- Backup data is placed on a different host to the primary, where possible.
- Backups of the partitions in a single JVM are spread evenly over the cluster.
The implication is that the loss of a single machine with be handled with the added benefit that the even distribution of backup data across the cluster makes redistribution events rapid (think BitTorrant).
However the loss of a second machine will, most likely, cause data loss if some of the data from the first machine is backed up on the second. The cluster won’t loose much, but it will likely loose some.
One suggestion for combating this is to increase the backup count. Unfortunately, in the current version, this doesn’t help. Coherence is really smart about how it places the first backup copy; putting it on a different machine where possible and spreading the backups evenly across the cluster. But when it comes to the second backup it is not so clever. The problem of backup placement is O(n), hence this restriction. As a result, configuring a second backup provides no extra guarantee that the second backup will be held on a different machine to the first, hence loss of two machines may still cause data loss (but the probability of this has been reduced).
Luckily there is light at the end of the tunnel. The Coherence team are working on smarter tertiary backups, or so I’m told.
Merging Data And Processing: Why it doesn’t “just work”
Sunday, August 30th, 2009
If you’ve been using Coherence for a while (or any other distributed cache service like Gigaspaces or Gemstone) you may well have had that wonderful ‘penny dropping’ moment when considering the collocation of data and processing. Suddenly you can perceive architectures where you no longer need to move all that data around before operating on it. Your grid already has it there at your disposal.
As a toy example lets conside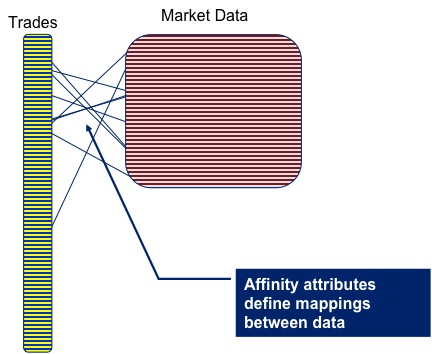 r pricing a large portfolio of trades. The pricing algorithm would require trade and market data as input, but as these are logically distinct entities you are likely to store each in a different cache. But for efficiency you’ll need the data for the corresponding trade and the market data on the same node, so that wire calls to collocate them don’t need to be made prior to pricing.
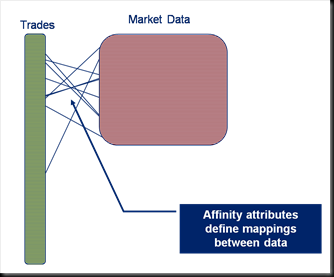
Coherence gives you a great way to do this: Affinity instructs Coherence to store data in a certain way, that is to say it is grouped together so that all data items with the same ‘affinity key’ are kept together (see figures).
Thinking along these lines you’d think we might have solved our pricing problem. We can use affinity to keep the trade and m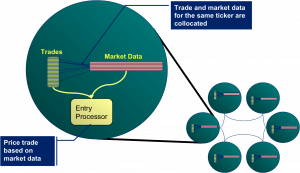 arket data together. As it happens this does work (depending somewhat on your data distribution). However it all falls to bits when you need to perform the processing to price the trade.
The problem is that you want to wrap the processing in a Coherence function that is ‘data aware’. Most likely an Aggretator or possibly an Entry Processor. The reasoning being this is that these functions will automatically route themselves to the nodes where the data resides.
The alternative approach is to use an invocable, but this is not data aware so you have to write extra code to route each request to the correct node (perfectly possible but not the most elegant or efficient solution).
So persisting with the data-aware functions as a wrapper for our pricing algorithm, lets say an Aggregator, you would quickly hit a problem with the way that Coherence is architected internally. Aggregators run inside the Cache Service (i.e. the service that manages data in Coherence) and the Cache Service threading model does not permit re-enterant calls [1].
So what does that mean? It means that, if you ran your Aggregator against the trades cache, you would not be able to call out from that Aggregator into the Market Data cache to get the data you require to price the trade. Such a call would ultimately cause a deadlock.
The 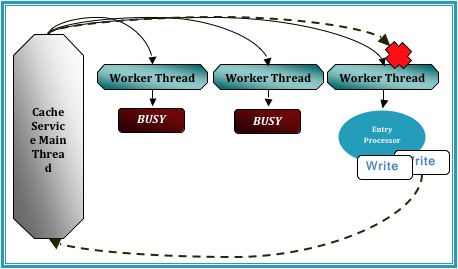 diagram demonstrates the CacheService threading model under a simulated deadlock. Even when the Cache service is configured with a thread pool there is the possibility that a re-entrant call will be scheduled back to the worker thread that is making that call, particularly in the case where the thread pool is small and the EntryProcessor workload is long.
A work around for this problem is to place the parent cache (or more precisely, the cache against which the Entry Processor or Aggregator is run) in a different Cache Service to the cache that the function is operating on. By splitting into at least two Cache Services the call to the ‘other’ cache will enter via a different Main thread to which invoked the Aggregator that you are currently running. This removes the possibility of deadlock.
 However, for our use case, spitting the market data cache and trades cache into different cache services is not an option as it breaks Affinity. The data items will no longer collocate (as affinity is based on the hashing algorithm Coherence uses to store data, and that algorithm is at a cache service level).
So how do you solve this problem. Well you have two options.
-
You sidestep the threading model by accessing the backing map directly. This way to can access the data in the market data cache using the thread you are on (without Coherence re-queuing it). The problem with this method is that it is a back door and that leaves you open to potential problems (could there be a time when you expect the item to be in the local JVM but it is not?)
-
As mentioned earlier you wrap your request in an invocable (which does not have the same threading issues as it runs in the Invocation Service) and route it to the correct machine yourself. This is described in the final diagram.
As to which is best to do. Well I guess that depends how risk averse you are 😉 but for what it’s worth I use the former.
[1] http://coherence.oracle.com/display/COH35UG/Constraints+on+Re-entrant+Calls
Coherence Part IV: Merging Data And Processing
Saturday, August 29th, 2009
A lot of people start using Oracle Coherence as a distributed cache because they need to get away from a data-bottlenecking problem. Many of open source NoSQL stores will help you with this problem too (if all you need is to stream large data volumes, being solely in memory is unlikely to be worth the additional hardware cost). However there are some big advantages to being entirely in memory. Distributed execution occurs next to the data it needs to operate on, either on request or as a result of some state change (think trigger), and this is a very powerful tool. This can lead to one of those ‘penny-dropping moment’ as the potential of merging data and processing, particularly in a wholly in-memory architecture, begins to unfold.
The benefits or moving computation to data have been around for a very long time – stored procedures being the classic example. The possibilities are extended significantly when the processing space is actually a distributed data grid, with all logic executing in the same language (in this case Java) and with data represented hierarchically (as objects) rather relationally. Suddenly a whole world of fast distributed processing on collocated data opens up.
Interestingly this is one of the main drivers for MapReduce (e.g. Hadoop): deal with very large data sets in a simple (albeit somewhat brute-force) way, collocating data and processing (although in Hadoop’s case it’s disk based) to allow processing to scale to peta- or exabytes. This same pattern can be applied in Coherence but with a slightly different as the goal: extending your application tier to allow real time processing in virtual address space that can grow to terabytes.
There are a couple of points worthy of note before we go on:
- The process of Merging Data and Processing is not seamless. The details of this are covered in another post. This article is meant solely as an introduction.
- There are in fact databases with exactly the same benefits, with respect to merging data and processing. VoltDB is closest (solely in memory, Java stored procedures) but there are many other shared nothing DBs that have impressive performance. Exasol and Paraccel are two worthy of note.
Data Affinity: Ensuring Collocation of Disparate Data Sets
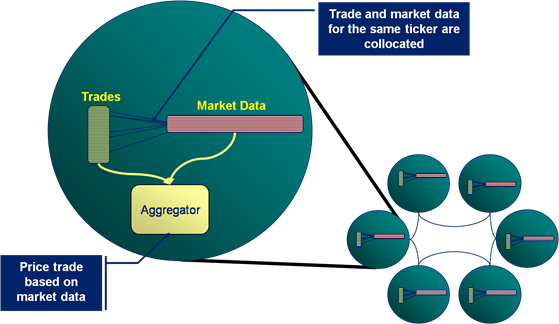
Data affinity allows associations to be set up between data in different caches so that the associated data objects in the two different caches are collocated on the same machine. In the example here trade data and market data are linked via the ticker meaning that all trades for ticker ATT will be stored on the same machine as the ATT market data.
Using Coherence to Run Processing in the Grid
Thus when an Entry Processor or Aggregator executes, say to run a trade pricing routine, it can access the trade and its market data without having to make a wire call as the market data for that particular trade will be held on the same machine (whenever possible).
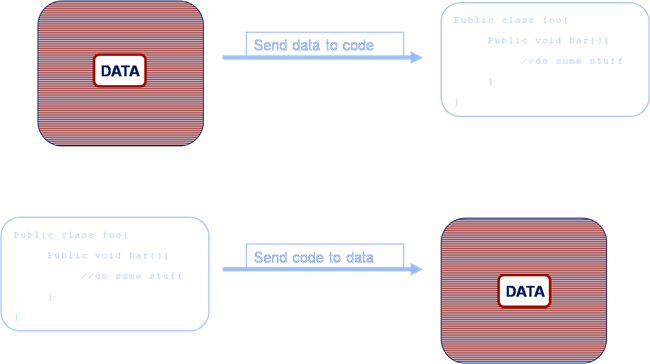
This presents the possibility of folding the classic service-centric approach in two[1]. Suddenly compute architectures can be merged into one layer that has responsibility for compute and data. The fundamental advantage being that far less data needs to be transmitted across the wire.
Increased Wire Efficiency
In a standard architecture (the upper example) data is retrieved from a data source and sent to the application tier for processing. However in the Coherence Application-Centric approach (the lower example) the code is sent to the machine that holds the data for execution. This is one of the real penny-dropping concepts that can revolutionise a systems performance.
But it is important to note that Coherence is not a direct substitute for a compute grid such as DataSynapse. Application-Centric Coherence involves leveraging in the inherent distribution Coherence provides as well as its inherent collocation of processing and data.
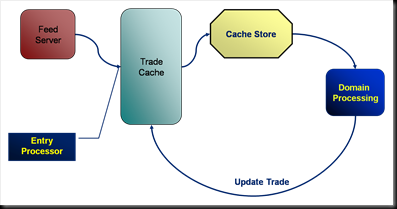
Thus looking at the anatomy of a simple Application-Centric deployment we see:
- A feed server enters a trade into the Trade cache using an Entry Processor to execute some pre-processing.
- This in turn fires a CacheStore which reliably executes some domain processing for that trade on the same machine.
- The domain processing results in the trade being updated in the cache.
This is just one sample pattern, there are many others. Simply using Aggregators (thing MapReduce) distribute work to collocated data on the grid is a powerful pattern in it’s own right. All these patterns share the ability to collocate domain processing in a Java across a large, distributed address space. This means that not only is the execution collocated with the data but the executions are implicitly load balanced across the Coherence cluster.
So Coherence has evolved from being a data repository to an application container which provides:
- Distribution of processing across multiple machines
- Fault tolerance of data and processing (including async)
- Scalability to potentially thousands of nodes
- The ability to collocate data and processing.
An enticing proposition!!!
[1] Service-Centric and Application-Centric are terms coined by Lewis Foti to describe the two broad architectural styles used to build Coherence based systems. Service-Centric architectures use Coherence simply as a data repository. Application-Centric users use Coherence as a framework for building event based distributed systems. Such systems leverage the inherent distribution and fault tolerance that comes with the product with operations being generally collocated with the data they require. This merges the Application and Data layers of the system.
See also:
- coherence-bootstrap on github
- Coherence Part I: An Introduction
- Coherence Part II: Delving a Little Deeper
- Coherence Part III: The Coherence Toolbox
Coherence Part III: The Coherence Toolbox
Sunday, July 19th, 2009
Coherence is so much more than a hash map. In this article we’ll introduce some of the main functions that a programmer has in their Coherence Toolbox. These include:
- CQC
- Near Caching
- Expiry
- Entry Processors
- Triggers
- Synchronous and Asynchronous Cache Stores
[Edit: There are running code samples that go well with this post in the coherence-bootstrap on github]
Aggregation: Coherence’s MapReduce
For operations that act on data that exists on multiple machines Coherence will parallelise the execution. The example shown here is a summation of “quantities” across a particular cache. Each machine in the cluster performs the summation for their portion of the data. The result of each of these is passed back to the serving node which performs the final summation and returns the final answer to the client. This is analogous to Google’s MapReduce pattern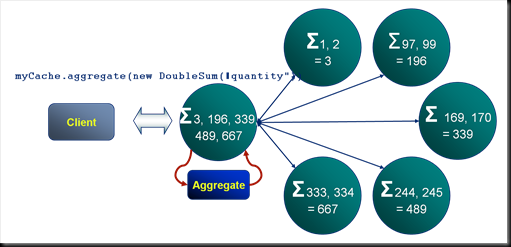
Near Caching: Where the Real Caching is at
All client processes can configure a near cache that sits “in process”. This cache provides an in-process repository of values recently requested. Coherence takes responsibility for keeping the data in each near cache coherent.
- Thus in the example shown here Client A requests key1 from the cluster. This is returned and the key-value pair are stored in the client’s in-process near cache.
- Next Client B writes a new value to key1 from a different process. Coherence messages all other clients that have the value near cached notifying them that the value for key1 has changed. Note that this is dynamic invalidation, the new value is not passed in the message.
- Should Client A make a subsequent request for key1 this will fall through to the server to retrieve the latest value.
Thus Near Caching is a great way to store data which may be needed again by a client process.
Continuous Query: Pub-Sub Queries at our Fingertips
In contrast to near caching, should a client application be interested in all updates made to a certain data set, a Continuous Query would be preferable. Continuous queries are used to define a query that will be proactively kept up to date by the cluster as data within it changes. Looking at the example:
- Client A initialises a ContinuousQueryCache using a filter that defines a subset of the entries in the cache, in this case all trades with the ticker “ATT”. The resulting dataset is held locally in the client’s process.
- Next Client B writes a value which is included in Client A’s continuous query. The cluster runs the continuous query filter against Client B’s write (if it is new) and determines its relevance to Client A’s continuous query. It messages both the key and value back to Client A, updating its locally cached copy with the new value.
Thus Continuous queries provide a proactively updated in-process data set to clients. Typical usages include:
- A trading blotter containing trades for a certain trader/book.
- Ticking prices for a certain Currency.
Thus in summary near caches receive invalidations only, with subsequent requests falling through to the server to get the changed data. Conversely continuous queries receive updates containing all new and changed data. So when might you use each of these? Use near caches by default for cases where there is likely to be reuse. Use continuous queries when it is known that all changes to a certain data set will be relevant to clients.
Expiry: Making Sure You Don’t Run Out of Memory
The cache types, Partitioned, Replicated and Near all support expiration policies for removing entries automatically from the cache. There are a set of basic expiration policies such as Most Recently Used, Least Frequently Used etc. Custom expiration policies, written in Java, can also be defined.
In the example here a client has a near cache configured to keep the most recent 1000 tuples. The partitioned backing cache on the server has a different expiration policy set that expires entries once they reach a certain age.
Indexes: Not So Much About Lookup Speed As Avoiding Deserialisation.
Coherence allows the addition of indexes to speed up access to objects via attributes other than the key of the HashMap. In the example here the Trade cache, which is keyed by Trade ID has an additional index added to the counterparties method on the trade object. Also note that, in this case, the counterparties method returns multiple values so the resulting index contains more entries than the cache itself.
Accessing data via its key actually turns out to be several times faster than accessing it via an index. The reason for this is two fold:
- Queries performed against a key can be directed straight to the node that the key is stored on via the well known hashing algorithm. Index queries however must be sent to all nodes. Although this is done in parallel the transaction must wait for the all responses.
- Keys are unique. Indexes in Coherence solve the general case (any cardinality) and as such are less efficient.
However the real boon of Coherence indexes is that in creating an index Coherence deserialises the object and caches the deserialised index key. Thus when computing the query each object does not need to be deserialised to look for a match.
Entry Processors: Avoiding Locking
Locking keys directly is supported in Coherence, but it is expensive. In the example here a client locks a key, performs an action and then unlocks it again. This takes a scary 12 network hops to complete. Fortunately, there is a better way…
Entry processors solve this distributed locking problem by executing a predefined piece of code, on the server, against a certain key. They represent one of the four primary constructs that Coherence offers and have the following properties:
- They execute on the machine that the key is located on.
- They execute synchronously with respect to that key (i.e. the key is write-locked during the execution of the Entry Processor).
- They code they run has full access to the key and entry.
In this example the client invokes an Entry Processor against a specific key in the cache.
- A serialised version of the entry processor is passed from the client to the cluster.
- The cluster locks the key and executes the passed Entry Processor code. The Entry Processor performs the set of actions defined in the process() method.
- The cluster unlocks the key.
Thus an arbitrary piece of code is run against a key on the server.
Here we see an example of an entry processor, the ValueChangingEntryProcessor which updates the value associated with a certain key. Note that in contrast to the locking example described on a previous slide, this execution involves only 4 rather than 12 network hops.
class ValueChangingEntryProcessor extends AbstractProcessor {

   private String newValue;

   public ValueChangingEntryProcessor(String newValue) {

      this.newValue = newValue;

   }

   public Object process(InvocableMap.Entry entry) {

      entry.setValue(newValue);

      return "The value has been set to " + newValue;

   }

}
Invocables: Making Yourself a Little Compute Grid
Invocables are the second of the four primary constructs and are analogous to a DataSynapse grid task in that they allow an arbitrary piece of code to be run on the server. Invocables are similar to Entry Processors except that they are not associated with any particular key. As such they can be defined to run against a single machine or across the whole cluster.
In the example here an Invocable is used to invoke a garbage collection on all nodes on the cluster. Other good examples of the use of Invocables are the bulk loading of data, with Invocables being used to parallelise the execution across the available machines. 
Server Side Eventing I: Triggers
Triggers are the third of the four primary constructs and are analogous to triggers in a database. In the example here the client writes a tuple to the cache and in response to this event a Trigger fires, executing some user defined code. The code is executed synchronously, that is to say that the key is locked for the duration of the execution.
Server Side Eventing I: Cache Stores
The last of the four primary constructs is the CacheStore. CacheStores are usually used to persist data to a database and contain built in retry logic should an exception be thrown during their execution.
Looking at the example here:
- The client writes a tuple to the cache.
- This event causes a CacheStore to fire in an attempt to persist the tuple. Note that this may be executed synchronously or asynchronously.
- In this case the user defined code in the CacheStore throws an throws an exception.
- The CacheStore catches the exception and adds the store event to a retry queue.
- A defined period of time later the cache store is called again. This time the execution succeeds and the tuple is written to the database.
The retry queue is fault tolerant. So long as the cluster is up it will continue to retry store events until they succeed.
Should multiple values be received for the same key during the write delay of an asynchronous CacheStore the values will be coalesced, that is to say that only the most recent tuple will be persisted. This coalescing also applies to the retry queue.
Your Coherence Toolbox
Thus, to summarise the four primary constructs:
- Both Entry Processors and Invocables are called from the client but run on the server. They both except parameters during construction and can return values after their execution.
- Triggers/BackingMapListeners and CacheStores both run on the cluster in response to cache events.
- Triggers/BackingMapListeners, like Entry Processors, lock on the key for which they are executing. Synchronous cache stores also lock but their use in asynchronous mode tends to be more common.
- Cache stores are guaranteed, in that they will retry should execution fail and this retry logic is fault tolerant (it will retry on a different machine should the one it is running on fail). They also coalesce changes.
See also:
- There are running code samples for these in coherence-bootstrap on github
- Coherence Part I: An Introduction
- Coherence Part II: Delving a Little Deeper
- Coherence Part III: The Coherence Toolbox
- Coherence Part IV: Merging Data And Processing
Coherence Part II: Delving a Little Deeper
Saturday, May 16th, 2009
Coherence: A Shared Nothing Architecture
Although Oracle Coherence may have a simple interface, behind it lies a some pretty cool tech. The heart of Coherence’s primary storage unit, the distributed cache, is it’s data partitioning algorithm. This is analogous to Horizontal Partitioning or Sharding in database terminology. Vertical partitioning is the corollary of Horizontal partitioning, where database tables are split, by columns, into different tables (this process being called Normalisation). In Horizontal Partitioning tables are broken up into sets of rows through a partitioning algorithm, usually defined by the user. This the the fundamental concept behind any partitioned database (such as RAC or Terradata).
Unlike some simple clustered data repositories, which rely on copies of the dataset being held on each machine, Coherence spreads its data across the cluster using a Horizontal Partitioning strategy based on a hash its key. Thus each machine is responsible for its own portion of the data set.
Thus, in the example seen below, the user requests the key “2” from the cache (note that a cache is analogous to a table in a database, it is single HashMap instance). The query for key “2” is directed to the single machine on which the data resides. In this case the node in the top left corner.
A subsequent request for key “334” is routed to the machine in the bottom left corner as it is this machine which is responsible for that key.
Although the main storage mode is the partitioned cache, where the data is distributed across all machines in the cluster. It also supports the simpler case of the replicated cache, where each node has its own copy of the entire data set.
So when do you think a replicated cache might be the appropriate choice?
Well, the advantage of a replicated cache is that the data will always be held in-process. The downside is that writes to it must be sent to all machines and such actions are slow and arduous. Thus in general:
- Use a partitioned cache for general data storage.
- Use a replicated cache for fairly low volume, static data that needs to be used “in process” on the server.
The advantages of in-process data on the server will become apparent later on when we consider running code on the Coherence cluster itself. When performing such server-side executions having access to in process data (rather than having to make a wire call) becomes invaluable. More on this later…
How it Works: Reading and Writing
Lets look at what happens during a simple data retrieval operation. Here the client invokes a “get” operation to retrieve the value for the key:Key1. The request is directed to a connection proxy on the server. This manages the connection as well as forwarding the request on to the machine which it knows contains the key: Key1. It does this via the “Well known hashing algorithm”.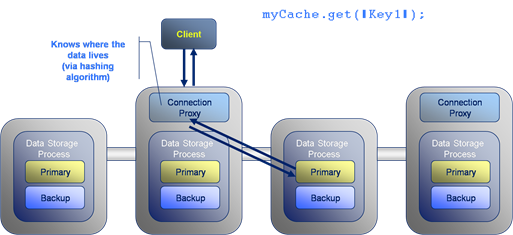
The Well Known Hashing Algorithm is the algorithm used to determine on which machine each hash bucket will be stored. This algorithm is distributed to all members of the cluster, hence “well known”. This has the effect that the location of all keys are known to all nodes.
Now looking at writing data to the cluster, the format is similar to gets with the put travelling through a connection proxy which locates the data to be written and forwards on the write. The difference is that writes must also be written to the backup copy which will exist on a different machine. This adds two extra network hops to the transaction.
How it works: Communication Protocols
Coherence uses different protocols to communicate between different services.
- Client connect to via a TCP/IP based protocol called TCP*Extend.
- Cluster members use multicast based messaging to discover new cluster members and to heartbeat.
- Cluster members use a custom protocol, built on top of UDP for reliable communication within the cluster. As a result the protocol management usually performed in layers above the Transport layer of the network stack – most notably packet ordering and reliable delivery – are managed by Coherence itself in the Java cache-server process.
Coherence includes a clever mechanism for detecting and responding to node failure. In the example given here node X suffers a critical failure due to say a network outage or machine failure. The surrounding cluster members broadcast alerts stating that they have not heard from Node X for some period of time. If several nodes raise alerts about the same machine a group decision is made to orphan the lost node from the cluster.
Once Node X has been removed from the cluster the backup of its data, seen here on the node to its left, is instantly promoted to being a Primary store. This is quickly followed by the redistribution of data around the cluster to fully backup all data and to ensure there is an even distribution across the cluster. The redistribution step is throttled to ensure it does not swamp cluster communication. However this step completes more quickly on larger clusters where less data must be redistributed to each node.
Coherence has a propiatary object serialisation and communication protocal called PIF/POF standing for Portable Invocation Format and Portable Object Format respectively. POF is particuarly important as apart from being highly compressed (when compared to Java serialisation) it allows deserialisation into C++ and .NET Coherence clients. There is a detailed post on the internals of POF here.
In the example the C# client defines the POF serialisation routine which is executed by the IPofSerialiser (written in C#) to create a POF object which is stored in the cluster. When a Java client requests the same object it is inflated with the PofSerialiser (written in Java) to create a comparable Java object.
The previous slide covered the marshalling of data from one language to another. However non-Java clients also need to execute code on the cluster and, as the cluster is written in Java, any executions run there must also be in Java. To solve this problem server side code, such as the Invocable shown here, is mapped from a C# implementation on the client to a Java implementation on the server. Thus calling MyInvovable in C# will result in the Java version of MyInvocable being run on the server with the objects it uses being marshalled from one language to another via POF (as described in the previous slide).
Client Types
There are two types of client in Coherence:
- Extend Client: Connects to the cluster via TCP*Extend which is a protocol based on TCP-IP. This is the typical means for connecting to the cluster, is lightweight and scalable.
- Compute Clients: These are cluster members running in a data-disabled mode. They are heavier processes needing tens of seconds to initialise as part of the cluster. However they are faster as they know the location of data (via the well known hashing algorithm).
Monitoring: Boring but Necessary
Monitoring of Coherence is done via inspection of the MBeans it publishes over JMX. JConsole tends to the be tool used to do this although there are a variety of other alternatives including RTView which presents a much richer interface onto the information Coherence produces.
The Coherence JMX implementation includes Mbean publication from each cluster member which is collated via a singe nominated JMX Collector node. The JMX Collector makes all MBeans available to users via JMX.
See also:
- Running code samples in coherence-bootstrap on github
- Coherence Part I: An Introduction
- Coherence Part III: The Coherence Toolbox
- Coherence Part IV: Merging Data And Processing
- POF Internals
Coherence Part I: An Introduction
Wednesday, March 4th, 2009
You can think of Coherence as simply being a distributed cache. It is after all what it was designed to do. But doing so would be something of an injustice. If a caching layer is all you need there are probably cheaper options. What you get with Coherence is a well thought out, simple framework for dealing with distributed data.
In one dimension it has moved towards the traditional database space, offering query functionality, indexing etc. In another it has encroached on the world of the application container by providing a framework for low latency, highly available, distributed systems in Java. It is its evolution into both of these, traditionally disparate, technology spaces that make it such a unique and useful product to use.
Coherence is still a traditional distributed cache under the covers, and is a pretty good one at that. So if you simply require fast access to prefabricated data (that is to say data that has been pre-processed into the required form), and you work in one of the 3 main languages (particularly Java), Coherence is still likely to be a decent choice, but there are quite a few cheaper alternatives these days, so bear that in mind.
It’s also important to understand the limits of the technology and Coherence certainly has its limits (for example). A large proportion of Coherence’s performance and scalability gains come from it’s adoption of a shared nothing architecture (I’ve written more on shared nothing architectures here). This means it excels in certain situations and quite the opposite in others. Learning to use the technology is about learning its limits. It should be one of the many tools in your architectural toolbox, but a fantastic tool to have.
Coherence is laid out over three distinct layers; client, cluster, persistence (see opening figure). The Coherence cluster itself is sandwiched between the client on the left and the persistent data source on the right. The client has it’s own, in process, 2nd level cache. The persistent data source is usually only used for data writes, it does not contribute to data retrieval (as the cluster, in the centre of the diagram, will typically be pre-populated with data, but more on that later).
Coherence has three major things going for it; it is fast, fault tolerant and scalable. Lets look at each of these in turn…
Coherence is Fast
Coherence’s speed can be attributed to five major attributes of it’s design:
- It stores all data solely in memory. There is no need to go to disk.
- Objects are always held in their serialised form (using an efficient binary encoding named POF – find out more about this here). Holding data in a serialised form allows Coherence to skip the serialisation step on the server meaning that data requests only have one serialisation hit, occurring when they are deserialised on the client after a response. Note that both keys and values are held in their serialised form (and in fact the hash code has to be cached as a result of this).
- Writes to the database are usually performed asynchronously (this is configurable). Asynchronous persistence of data is desirable as it means Coherence does not have to wait for disk access on a potentially bottlenecked resource. As we’ll see later it also does some clever stuff to batch writes to persistent stores to make them more efficient. The result of asynchronous database access is that writes to the Coherence cluster are fast and will stay fast as the cluster scales. The downside being that data could be lost should a critical failure occur. As a result you should only use this asynchronous behaviour for data you don’t mind loosing.
- Queries use indexes which are sharded across the data grid. Thus queries follow a divide and conquer approach.
- Coherence includes a second level cache that sits in process on the client. This is a analogous to a typical caching layer, holding an in-process copy. This copy can be kept coherent either via setting a near-cache to be ‘present’ or via using a ‘continuous query’
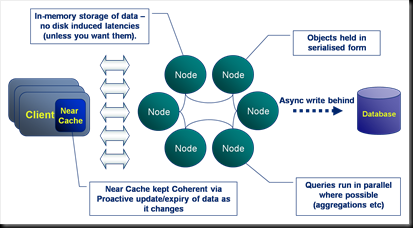
Coherence is Fault Tolerant
Coherence is both fault tolerant and highly available. That is to say that the loss of a single machine will not significantly impact the operation of the cluster. The reason for this resilience is that loss of a single node will result in a seamless failover to a backup copy held elsewhere in the cluster. All operations that were running on the node when it went down will also be re-executed elsewhere.
It is worth emphasizing that this is one of the most powerful features of the product. Coherence will efficiently detect node loss and deal with it. It also deals with the addition of new nodes in the same seamless manor.
Coherence is Scalable
Coherence holds data on only one machine (two if you include the backup). Thus adding new machines to the cluster increases the storage capacity by a factor of 1/n, where n is the number of nodes. CPU and bandwidth capacity will obviously be increased too as machines are added. This allows the cluster to scale linearly through the simple addition of commodity hardware. There is no need to buy bigger an bigger boxes. It should be noted that scalability only comes with key-based access. As noted previously (here) queries will not scale linearly as you increase the number of nodes.
So we can summarise why Coherence is faster than traditional data repositories.
- Coherence works to a simpler contract. It is effic
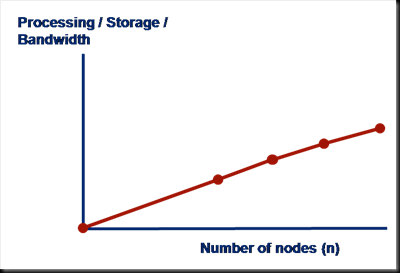 ient only for simple data access. As such it can do this one job quickly and scalably.
 - Databases are constrained by the wealth of features they must implement. Most notably (from a latency perspective) ACID.
- High performance users are often happy to sacrifice ACID transactions for speed and scalability.
So What Is Coherence Really?
Most importantly, Coherence is just a map. All data is stored as key value pairs. It offers ‘some’ functionality that goes beyond this but it is still the fundamental structure of the product and hash based access to the key/value pairs it contains is fundamental to the way it works at the lowest level.
In a typical installation Coherence will be prepopulated with data so that the cluster become the primary data source rather than just a caching layer sitting above it (Coherence offers both modes of operation, it just so happens that almost everyone I know does it this way). The main reason that ‘read through’ is not often used is that (i) it adds latency to early client transactions and (ii) the map contains in indeterminate quantity of data meaning that searches (queries) against the cache will return indeterminate results.
Coherence is not a database. It is a much lighter-weight product designed for fast data retrieval operations. Databases provide a variety of additional functionality which Coherence does not support including ACID (Atomic, Consistent, Isolated and Durable), the joining of data in different caches (or tables) and all the features of the SQL language.
Coherence is not a Database
Coherence does however support an object based query language which is not dissimilar to SQL. There is now even an SQL-like declarative language you can use too. However Coherence is not suited to complex data operations or long transactions. It is designed for fast data access via lookups based on simple attributes e.g. retrieving a trade by its trade ID, writing a new trade, retrieving trades in a date range etc as well as executing data-centric custom functions (more to come on this later)
Coherence does not support:
- Transactions (ACID)*
- Joins
- SQL**
* There is now (as of 3.6 I think) support for transactional caches. I’ve not used them to be honest and they have a number of restrictions. If you need transactions though you should probably look at alternative technologies.
** Coherence does support a simpler, object based query language but it is important to note that coherence does not lend itself to certain types of query, in particular large joins across multiple fact tables. There is now a newer declarative language option too.
Comparing Coherence with Other High Performance Data Repositories
Now lets compare Coherence with some other prominent products in the Oracle suite. Firstly lets look at the relationship with Oracle RAC (Real Application Cluster).
RAC is a clustered database technology. Being clustering it, like Coherence, is fault tolerant and highly available – that is to say that loss of a single machine will not significantly effect the running of the application. However, unlike Coherence, RAC is durable to almost any failure as data is persisted to (potentially several different) disks. However Coherence’s lack of disk access makes it significantly faster and thus the choice for many highly performant applications. Finally RAC supports SQL and thus can handle complex data processing. RAC however is limited by the fact that it is a Shared Disk Architecture, whereas Coherence is Shared Nothing (This difference is beyond the scope of this article but is discussed in full here).
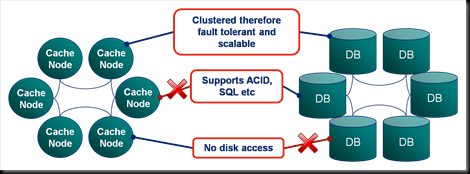 TimesTen is a totally different Oracle technology. It is a completely in-memory implementation of an Oracle database supporting most standard database functionality, but at much lower latency.
The support for in memory storage is clearly a feature of both TimesTen and Coherence thus making them both suitable for low latency applications.
However the big advantage of using Coherence is that it is distributed i.e. the data is spread across multiple machines. TimesTen is restricted to a single process and thus is neither highly available nor scalable beyond the confines of a single machine (although it can be configured for fault tolerance).
However TimesTen offers most of the support that a database offers including:
- Transactions
- Complex query language (SQL) joins etc
- Heavily optimised query execution.
This makes it the obvious choice if complex data processing is required or there is an existing dependence on SQL.
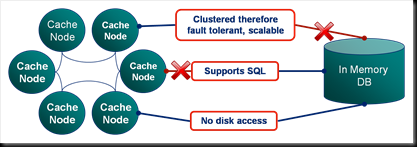 The other comparable technological space is the Shared Nothing database. These are databases that share the same architectural style where each node has sole ownership of the data it holds. Such systems are currently used for a rather different use case; data warehousing as apposed to OLTP applications. However this is likely to change in the near future. You can find more discussion of Shared Nothing databases here. My SNDB of choice is ParAccel.
Finally Coherence there are a number of other competitors out there which are pretty good. If you’re reading this today (I’m updating this in 2013) you should be checking out some of the open source alternatives. Hazlecast is the most obvious which now has a mature and well funded project that plays in the same product space. Gemfire, Terracotta and Gigaspaces are the direct competitors. If you are just looking for scalable caching layers with query semantics you might be better looking at a NoSQL disk based solution. These are much cheaper to run in the long term and keeping all your data in memory is often overkill if you are not operating on it directly. Check out MongoDB and Couchbase which are the two NoSQLs most closely related and both open source.
See also:
- Coherence Bootstrap – Getting Started Quickly with Oracle Coherence (Github)
- Coherence Part II: Delving a Little Deeper
- Coherence Part III: The Coherence Toolbox
- Coherence Part IV: Merging Data And Processing
- POF Internals
